
Berkas:BirthDeath 1950 RU.svg

Ukuran pratayang PNG ini dari berkas SVG ini: 480 × 280 piksel Resolusi lainnya: 320 × 187 piksel | 640 × 373 piksel | 1.024 × 597 piksel | 1.280 × 747 piksel | 2.560 × 1.493 piksel.
Ukuran asli (Berkas SVG, secara nominal 480 × 280 piksel, besar berkas: 8 KB)

Ringkasan
| Deskripsi |
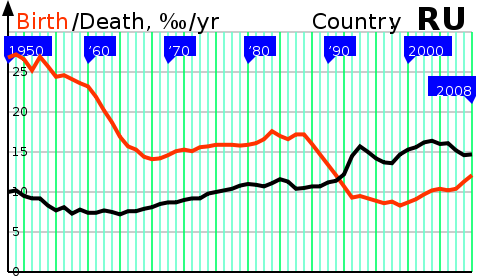
Русский: Рождаемость и смертность в РСФСР и Российской Федерации 1950 – 2008 (Демографический кризис в Российской Федерации). |
| Tanggal | |
| Sumber | Karya sendiri |
| Pembuat | Incnis Mrsi |
| Versi lainnya | BirthDeath 1979 RU.svg, RNI 1950 RU.svg, Russian Cross.jpg, Natural Population Growth of Russia.PNG |
| SVG genesis | Gambar vektor ini dibuat menggunakan unknown tool |
Disclaimer: The author of this graph gives no warranty and accepts no responsibility for its factual accuracy. This graph is nothing but a visualization of data from [1] [2], which may be incomplete or error-prone.
If you find an error, please, correct the data in a <path d="…"/> tag (adding some comments about your reliable source) and upload the file over.
Lisensi
| Saya, pemegang hak cipta karya ini, merilis karya ini ke domain umum. Lisensi ini berlaku di seluruh dunia. Di sejumlah negara, tindakan ini tidak memungkinkan secara sah; bila seperti itu: Saya memberikan siapa pun hak untuk menggunakan karya ini untuk tujuan apa pun, tanpa persyaratan apa pun, kecuali yang ditetapkan oleh hukum. |
Riwayat berkas
Klik pada tanggal/waktu untuk melihat berkas ini pada saat tersebut.
| Tanggal/Waktu | Miniatur | Dimensi | Pengguna | Komentar | |
|---|---|---|---|---|---|
| terkini | 13 Juli 2009 07.09 | | 480 × 280 (8 KB) | Incnis Mrsi | {{Information |Description={{en|1=The birth and death rates in Russia 1950–2008 (w:Russian Cross).}} {{ru|1=Рождаемость и смертность в РСФСР и Россиийской Федерации 1950 – 2008 ([[ru:Русск� |
Penggunaan berkas
Halaman berikut menggunakan berkas ini:
Penggunaan berkas global
Wiki lain berikut menggunakan berkas ini:
- Penggunaan pada ast.wikipedia.org
- Penggunaan pada cs.wikipedia.org
- Penggunaan pada en.wikipedia.org
- Penggunaan pada es.wikipedia.org
- Penggunaan pada lt.wikipedia.org
- Penggunaan pada pt.wikipedia.org